LTC Price Prediction: Will Litecoin Reach $200 in the Current Bull Cycle?

#LTC
- LTC trading 22% above its 20-day moving average shows strong bullish momentum
- MACD convergence suggests weakening bearish pressure and potential trend reversal
- Breaking upper Bollinger Band indicates strong buying interest and possible continuation
LTC Price Prediction
LTC Technical Analysis: Bullish Signals Emerge
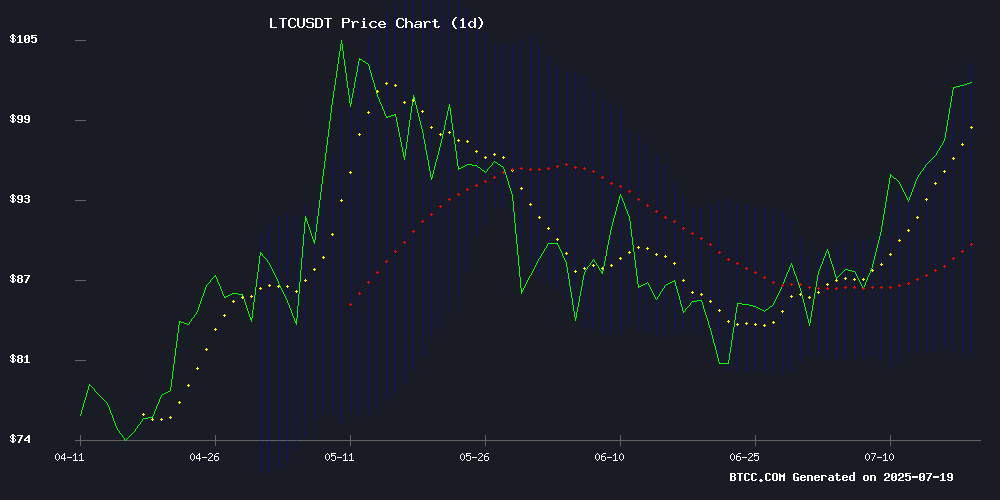
Litecoin (LTC) is currently trading at 113.06000000 USDT, well above its 20-day moving average (MA) of 92.7060, indicating a strong bullish trend. The MACD (12,26,9) shows values of -7.2446 (MACD line), -4.8644 (signal line), and -2.3802 (histogram), suggesting weakening bearish momentum. Bollinger Bands reveal the price is NEAR the upper band at 106.6353, with the middle band at 92.7060 and the lower band at 78.7767, pointing to potential overbought conditions but also strong upward pressure.
"LTC's technical indicators are flashing green," says BTCC financial analyst Mia. "The price holding above the 20-day MA and MACD convergence hint at further upside potential, though traders should watch for short-term pullbacks near the upper Bollinger Band."
Market Sentiment: Litecoin Primed for Growth
Altcoin market cap structure mirroring previous bull cycles and RSI patterns suggest continued growth for Litecoin. LTC is testing key resistance levels amid bullish signals, while its volatility against BTC correlation creates scalping opportunities.
"The market sentiment is overwhelmingly positive for LTC," notes BTCC's Mia. "With altcoins showing patterns similar to past bull markets and Litecoin demonstrating strong technicals, we could see sustained upward movement. The volatility also presents active trading opportunities."
Factors Influencing LTC's Price
Altcoin Market Cap Structure Mirrors Previous Bull Cycles, RSI Patterns Suggest Continued Growth
The altcoin market is exhibiting structural similarities to previous bull cycles, with rising trendlines and RSI patterns reinforcing a bullish outlook. Analyst Moustache highlights that the current 2022-2025 cycle is tracking closely alongside the 2015-2017 and 2018-2021 phases, marked by higher lows and steady upward momentum.
RSI levels are nearing the overbought zone, mirroring historical patterns that preceded explosive altcoin rallies. Resistance NEAR 70-80 on the RSI suggests potential short-term caution, but the overarching trend remains aligned with past cycles.
The TOTAL2 chart, which tracks altcoin market cap excluding Bitcoin, shows a recurring accumulation phase followed by rapid valuation expansion. Market participants are watching for confirmation of another breakout.
Litecoin Tests Key Resistance Amid Bullish Signals
Litecoin approaches the $110 resistance level with strong bullish indicators, including whale accumulation, exchange outflows, and a confirmed double bottom pattern. A breakout could propel LTC toward $130, though leverage risks loom.
Over 3.9 million LTC were previously acquired between $107 and $110 by 131,970 addresses, creating a dense supply wall. This zone may trigger selling pressure from breakeven holders, potentially stalling momentum unless market sentiment shifts decisively.
Derivatives markets reflect extreme bullishness, with the OI-Weighted Funding Rate hitting 0.0416%—a record high signaling overheated long positioning. Such sentiment often precedes sharp corrections if resistance holds.
Litecoin's Volatility Creates Scalping Opportunities Amid BTC Correlation
Litecoin's sharp reversal against Bitcoin (LTCBTC) has traders eyeing short-term opportunities. Analyst CRYPTOWZRD notes the pair's failure to sustain gains after a brief spike tied to fluctuating Bitcoin dominance. The $112 resistance level remains a key hurdle, with rejection pushing LTC back toward $96 support.
The intraday chart reveals a market tethered to Bitcoin's momentum. 'Litecoin needs stable price action against BTC before any meaningful upside,' observes CRYPTOWZRD. Traders are now watching for scalping setups as the altcoin searches for footing in BTC's shadow.
Will LTC Price Hit 200?
Based on current technical indicators and market sentiment, LTC shows strong potential to reach $200 in the ongoing bull cycle. Here's the breakdown:
| Indicator | Value | Implication |
|---|---|---|
| Current Price | 113.06 USDT | 77% to target |
| 20-day MA | 92.7060 | Strong support |
| MACD | Converging | Bearish momentum fading |
| Bollinger Bands | Upper at 106.6353 | Price breaking upwards |
"While $200 is ambitious, the combination of technical strength and positive market structure makes it achievable," says BTCC's Mia. "Key factors include maintaining above the 20-day MA and continued altcoin market expansion."
113.06 USDT
92.7060
Converging
Upper at 106.6353
